Growth & analytics Case study
Modeling the Customer Lifecycle: From Product Growth to Portfolio Growth
In this article

As Bold (opens in a new tab) evolved into a financial superapp, bringing multiple products together on a single platform, measuring growth in each product line in isolation gave us a limited view of our users. We needed a common framework to model the customer lifecycle across the portfolio, identify growth levers, and inform strategic decisions.
In 2019, Tribe Capital published an article titled “A Quantitative Approach to Product Market Fit (opens in a new tab)”, introducing the concept of Growth Accounting as a quantitative framework to understand and compare PMF across early-stage startups.
On the Product Growth team, we adapted the growth accounting approach to model the customer lifecycle across our product portfolio. We assigned each user a lifecycle state in each reporting period, then tracked transitions between states. This gave us a common framework for examining how users entered, continued using, left, and returned to each product.
In this post, we describe the model, the choices involved in defining its states, and the metrics we derived from it.
Building a growth accounting model
The idea is pretty simple. Just like financial accounting assigns meaning to the movement of money (those $5 are revenue, those $3 are costs), we could assign meaning to the actions (or lack thereof) of our users.
What matters most when modeling the customer lifecycle? A user’s next response as a function of their current lifecycle state. In other words, what do users in state X tend to do next? If you measure users’ next responses over time, you end up with a clear map of your customer lifecycle.
From there, just as in financial accounting, you can start creating customized metrics to dissect what is going on.
Assign all users a lifecycle state
Start with a clear definition of an active user. In our case, active users were those who made at least one transaction in the assigned period. Follow the mutually exclusive, collectively exhaustive (MECE) criteria:
- Include everyone
- All users who have interacted with your product must be assigned to one bucket.
- Assign one state
- All users could be assigned to only one bucket per time period.
To compare product lines, choose a single common period (usually monthly or quarterly), even though their natural usage frequencies might differ.
There are eight lifecycle states to which each user can be assigned based on their current activity and history.
Life Zone
Active this period
- New
- Users first active in the present time period (T).
- Activated
- Users active in the present time period (T), that were New in the previous period (T-1).
- Retained
- Users active in the present time period(T), that were first active in at least 2 previous periods (>T-2)
- Reactivated
- Users active in the present time period(T), that were Early Churned or Dormant in the previous period (T-1).
- Resurrected
- Users active in the present time period(T), that were Churned in the previous period (T-1).
Death Zone
Inactive this period
- Early Churned
- Users NOT active in the present time period(T), that were New or Activated in the previous period (T-1).
- Dormant
- Users NOT active in the present time period(T), that were NOT New or Activated in the previous period (T-1).
- Churned
- Users who have remained Dormant for more than two consecutive periods.
It is fine to build the first version of this model as a pure SQL query that computes states on every run. However, as your data grows, this query may become computationally expensive, and you’ll want to build a data mart or queryable table that contains the states per user per period.
Customer base over time
By lifecycle state
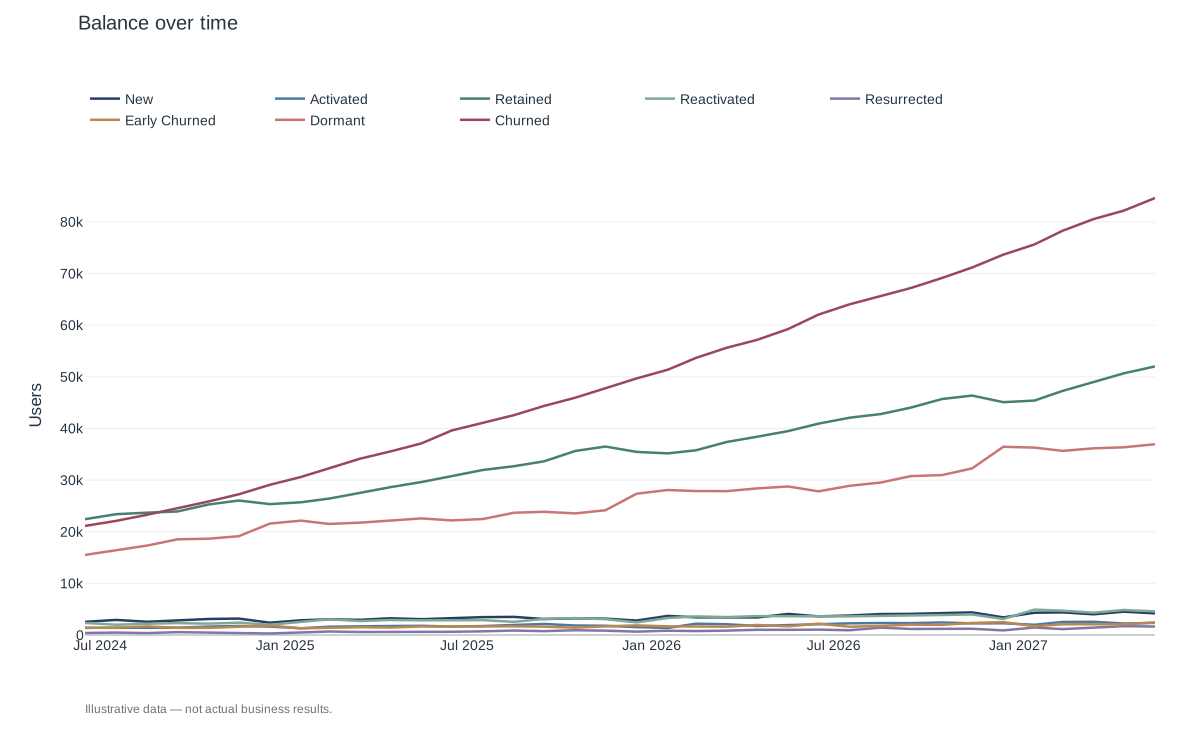
Since each user is assigned to a bucket per period, you can count the users in each bucket to compute its size. When you plot these counts over time, you get a picture of how your user base and products have developed and can start assessing the lifecycle stages.
By Life and Death Zone
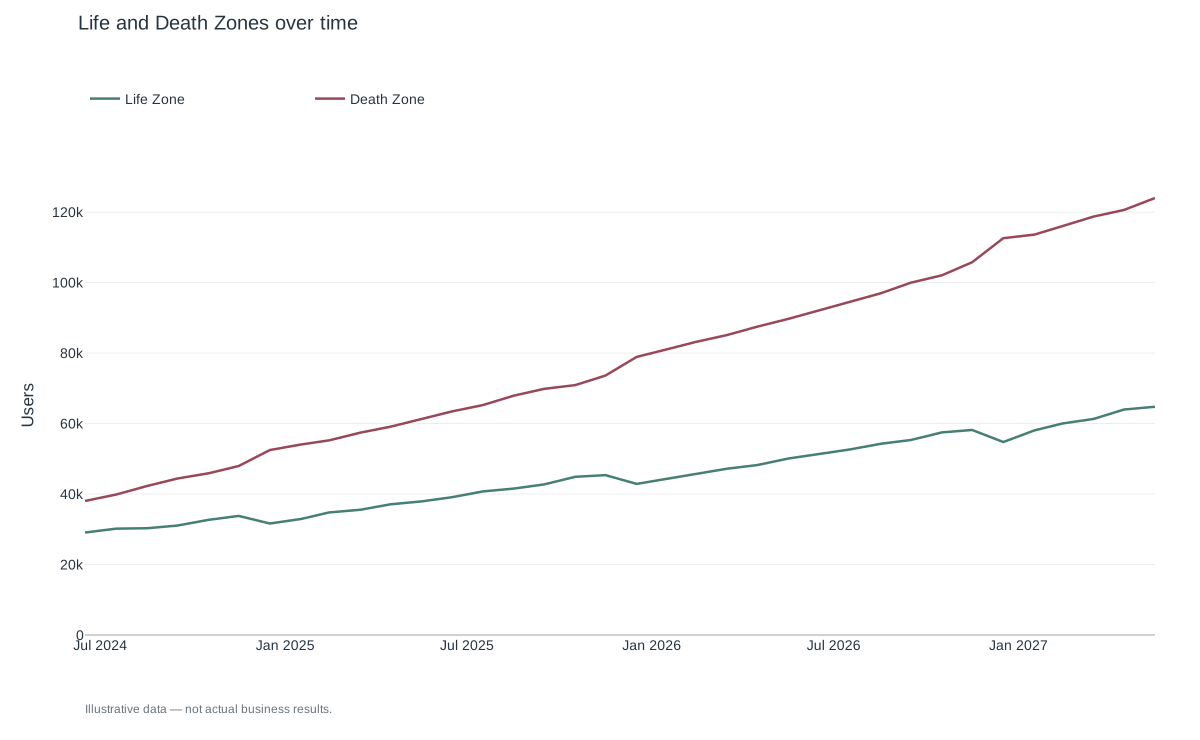
If you think about it, the defined buckets are just breakdowns of your active and inactive user base.
Life Zone = Active Users
The Life Zone is the sum of all users in the following categories: New, Activated, Retained, Reactivated, and Resurrected.
Your Life Zone should be exactly equal to your active user count for the established period.
Death Zone
The Death Zone is the sum of all users who were inactive in the established period: Early Churned, Dormant, and Churned.
As a company grows, the number of users in the Death Zone may surpass the active user count.
Routes
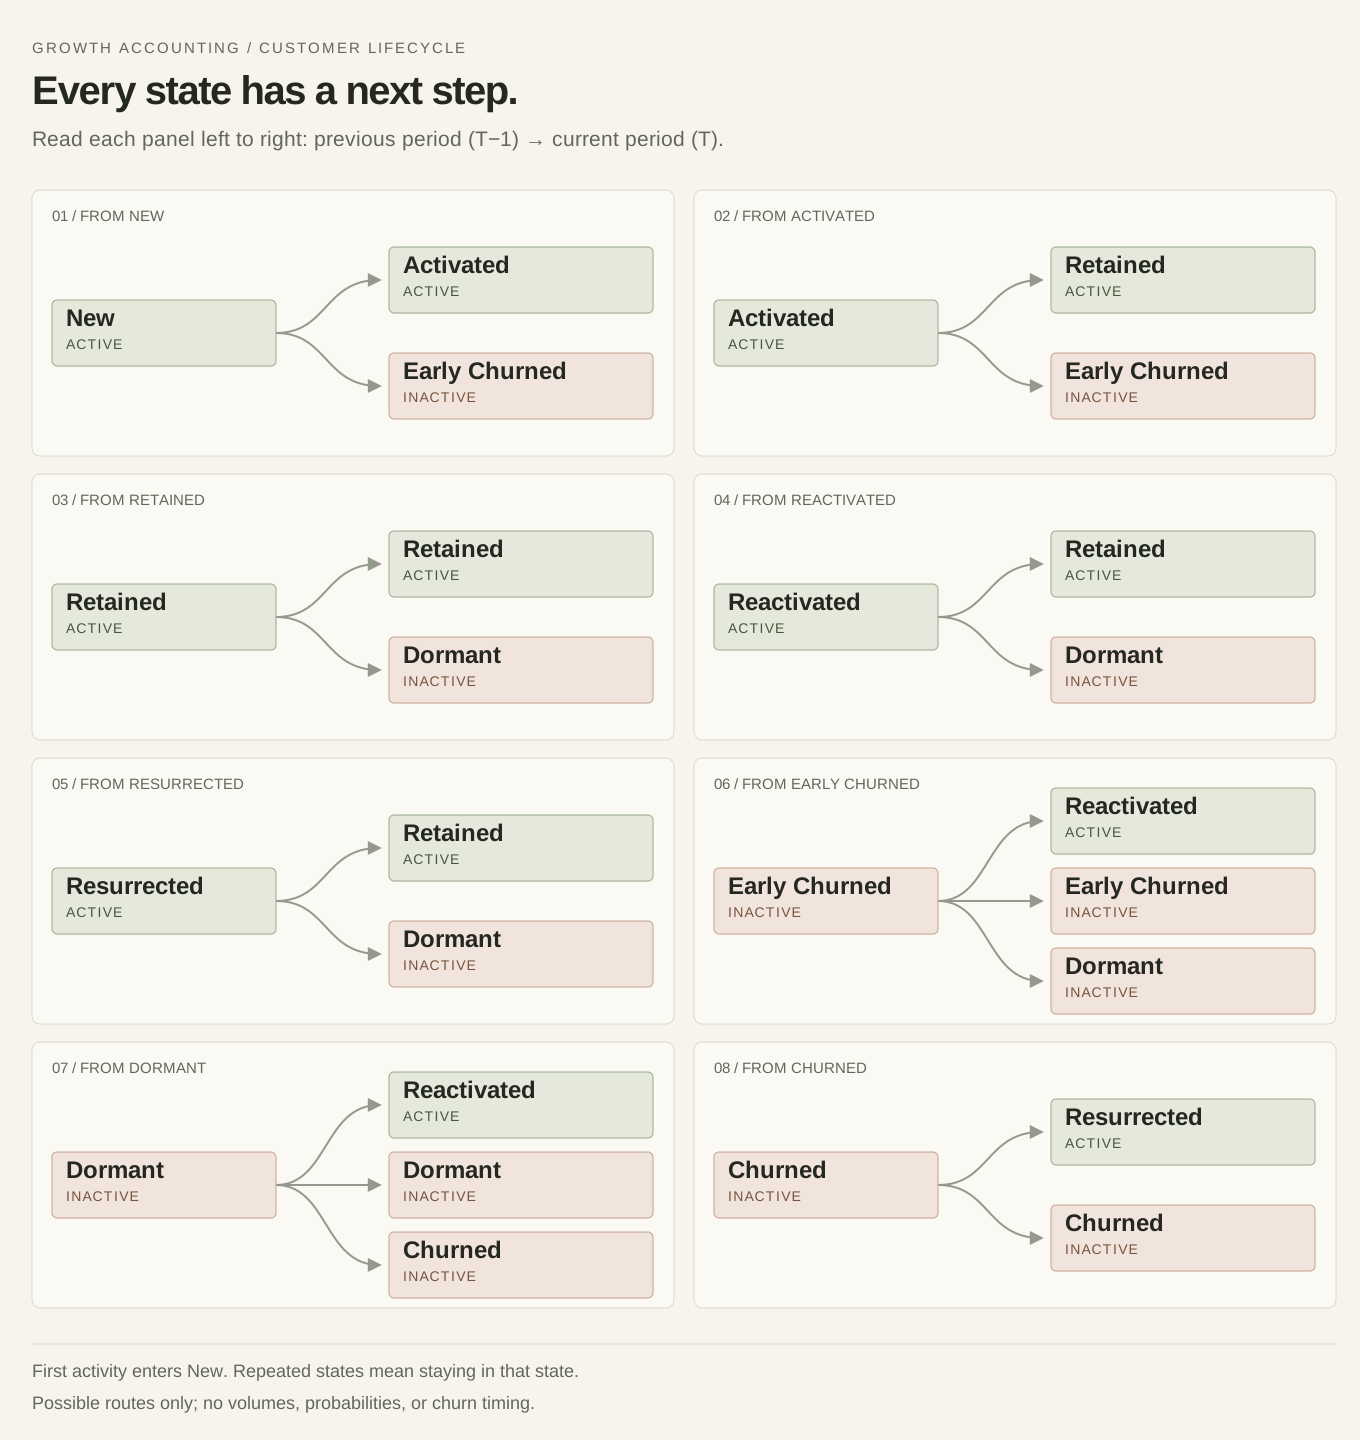
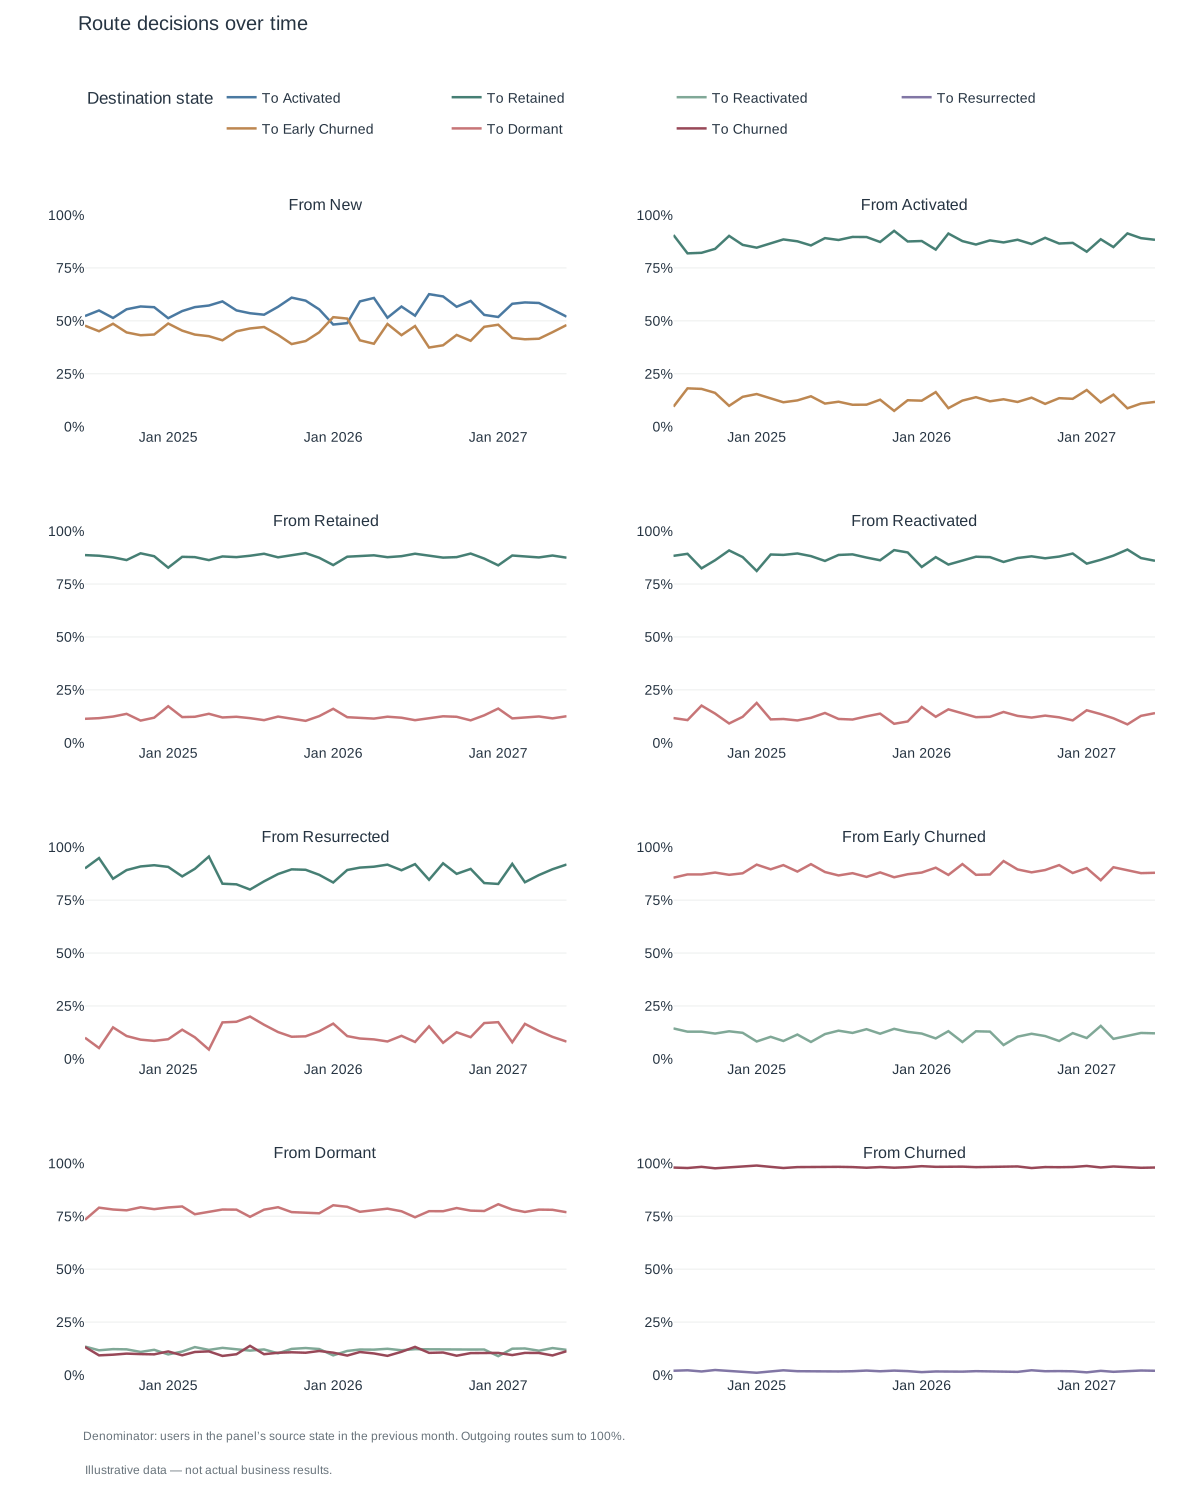
Since each user’s bucket assignment depends on their previous bucket, there is a finite number of possible transitions between buckets.
Read the routes as text
- New → Activated, Early Churned.
- Activated → Retained, Early Churned.
- Retained → Retained, Dormant.
- Reactivated → Retained, Dormant.
- Resurrected → Retained, Dormant.
- Early Churned → Reactivated, Early Churned, Dormant.
- Dormant → Reactivated, Dormant, Churned.
- Churned → Resurrected, Churned.
First activity enters New from outside the map. A repeated state means remaining in that state. Routes show possibilities, not measured volumes or probabilities; churn timing remains unspecified.
If you plot these transitions from period to period, you get a visual representation of where the greatest opportunities may lie.
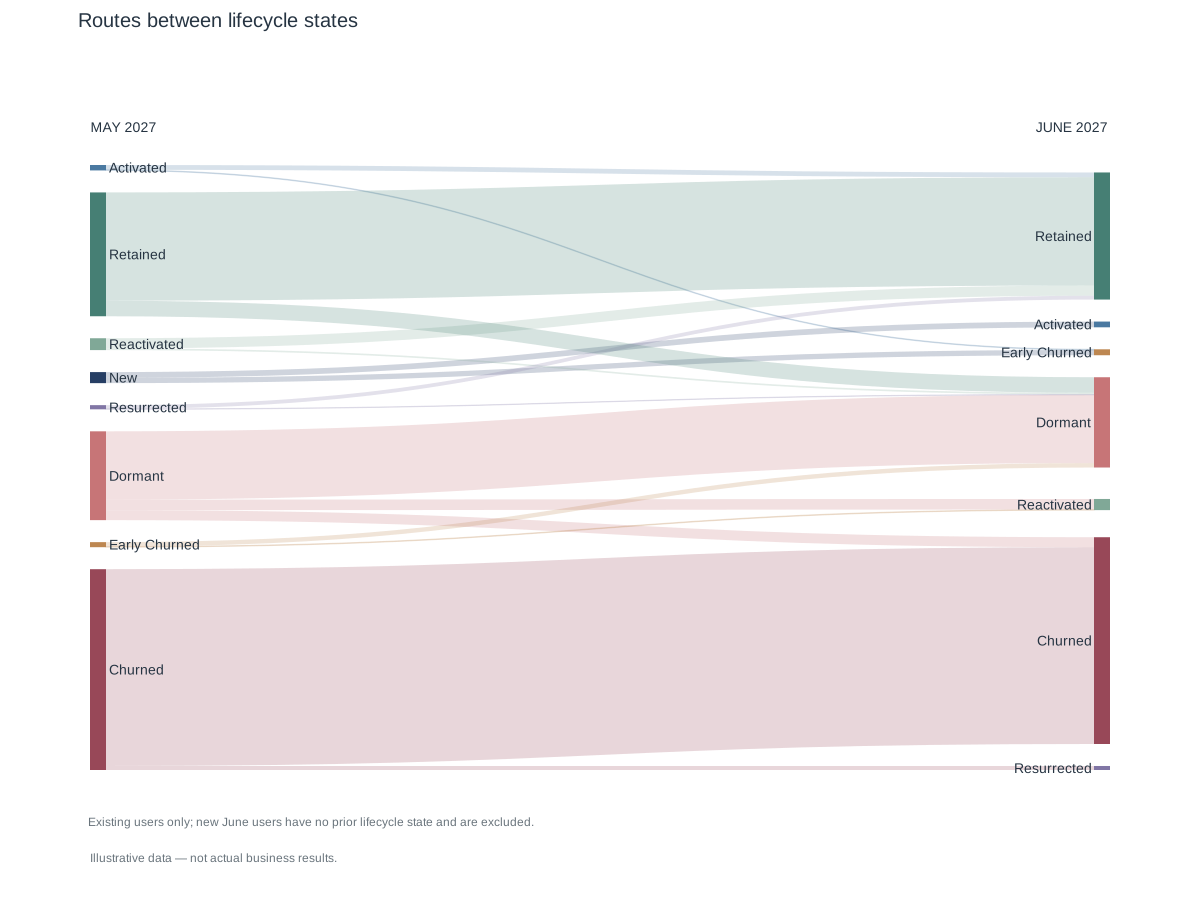
Your job then becomes figuring out how to influence users at that particular point in time to take the route that benefits the company. You also have a way to measure whether your efforts are working.
Portfolio Comparison
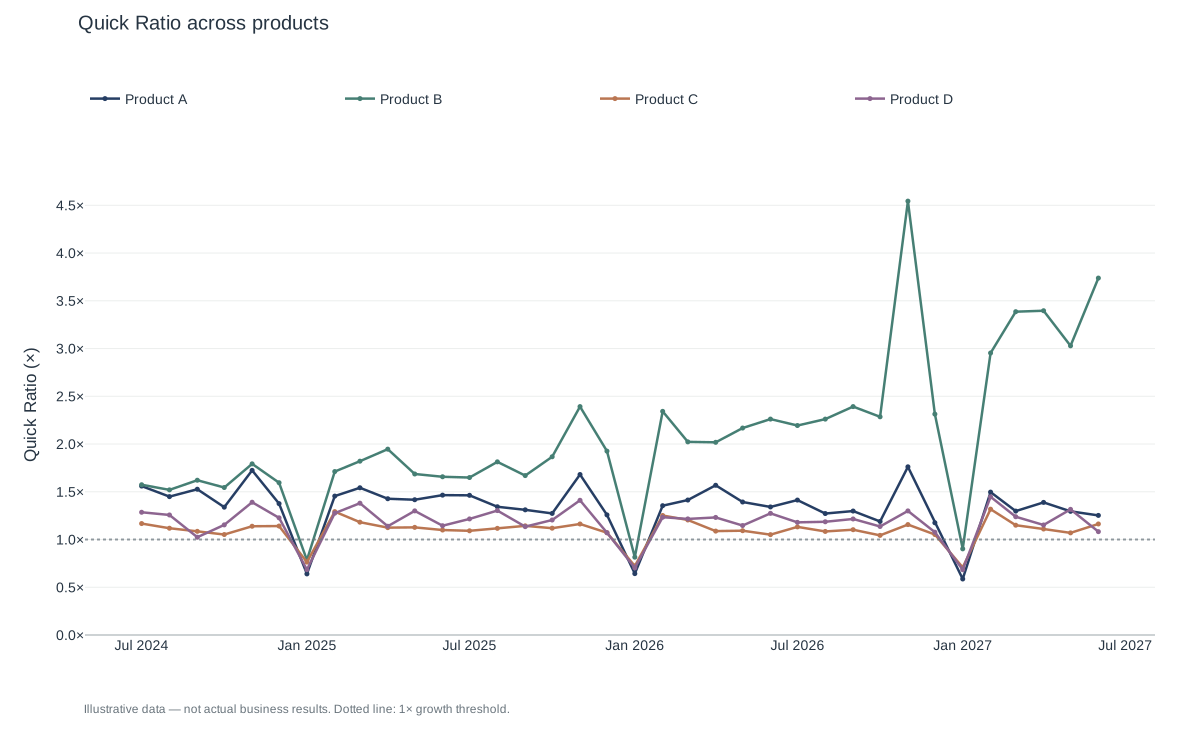
From there, you can start designing metrics to compare products across your portfolio. We found some specific metrics really useful for assessing the customer lifecycle of each product line.
Quick ratio
The quick ratio measures a product’s ability to sustain net growth. It answers the question: For every user I lose, how many users do I gain?
= Inflows/Outflows
= (New Users + In from death zone) / (Out from life zone)
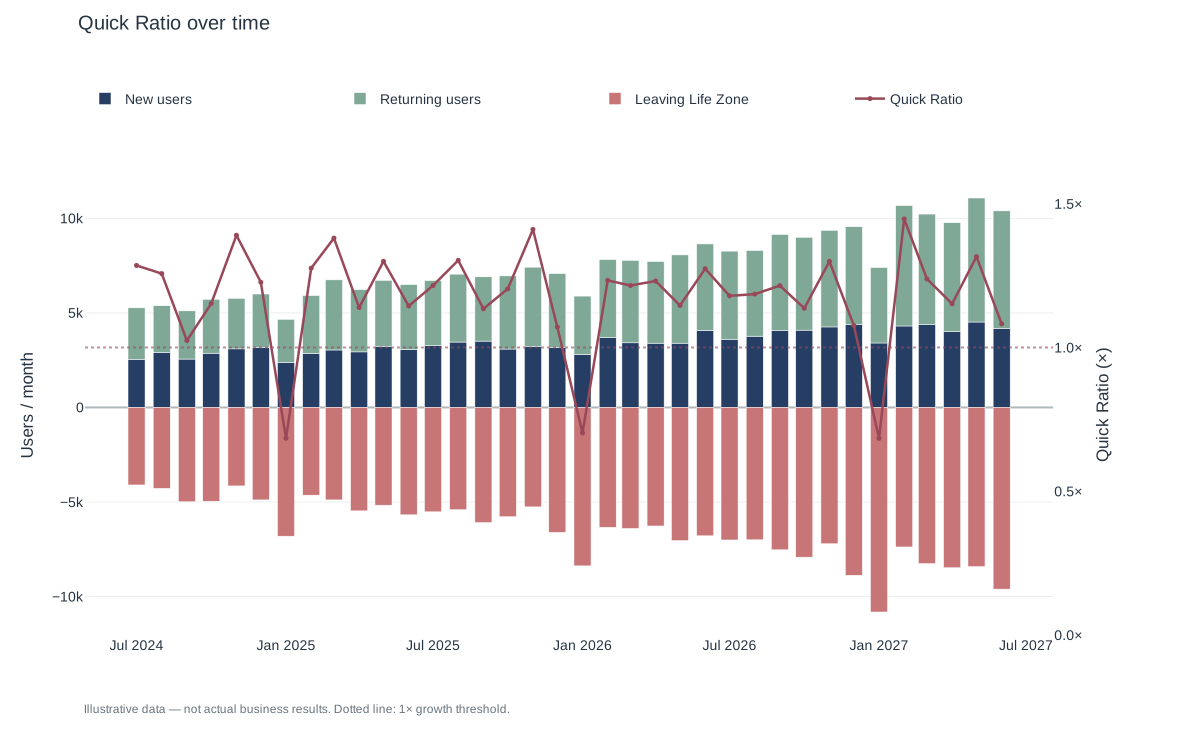
It ignores retained users and is independent of the size of the active user base, so we can compare it across products. It is only concerned with inflows and outflows. Note that any value greater than 1 indicates growth.
Leak
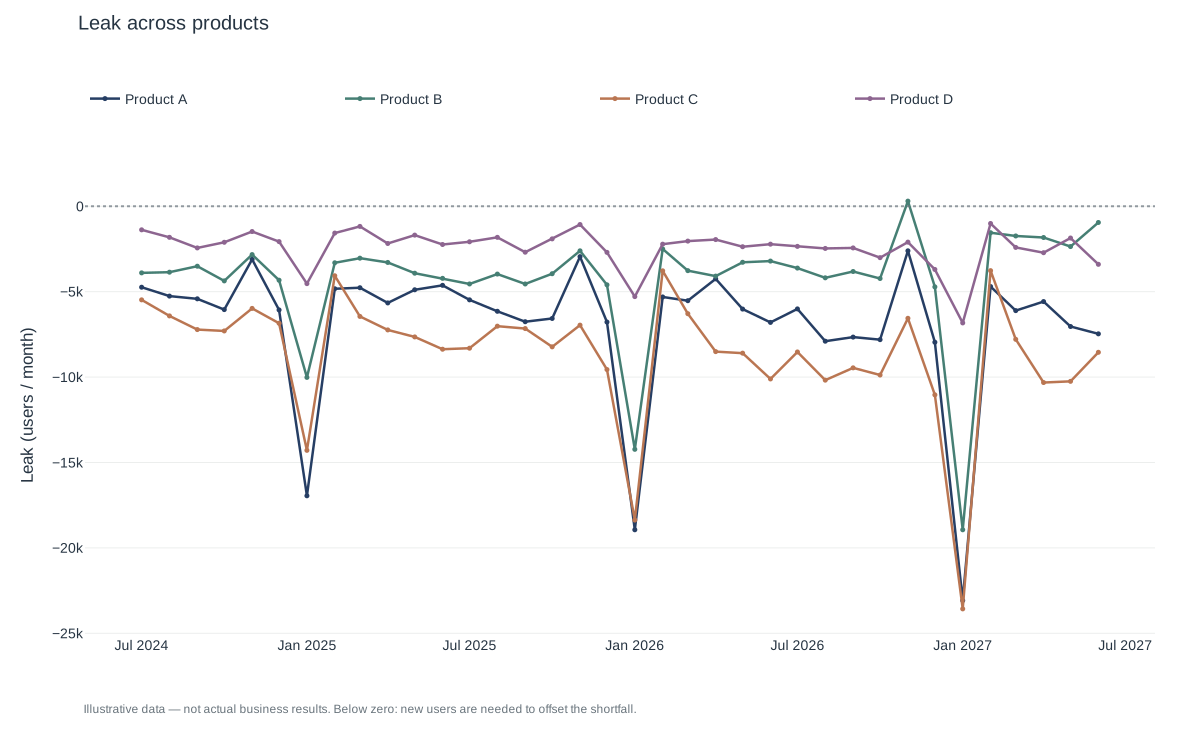
Notice that the net growth of the active user base is constrained by how many users are lost. This is the classic leaky bucket problem (opens in a new tab). You could go crazy acquiring new users, but if you are losing just as many, your net growth is far from enviable. So, we came up with the concept of Leak.
We display Leak as a signed balance: the users we recover through reactivation or resurrection, minus the users who leave the Life Zone.
= Internal Inflow (reactivated + resurrected) - Outflow
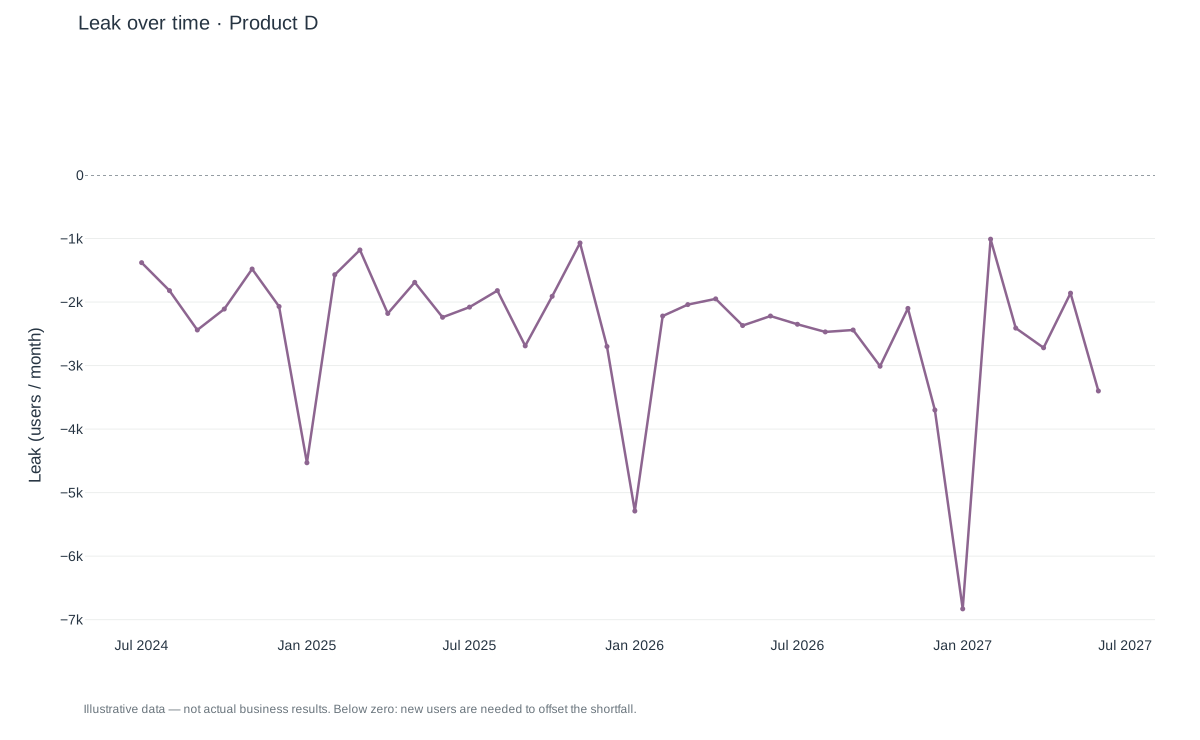
GTM and PMM teams usually have acquisition targets, but they may not know the minimum number of new active users needed to keep the active user base from shrinking.
When Leak is negative, its magnitude tells us that minimum. A Leak of -500 means these teams need to bring in 500 new active users during that period to hold steady, and more than 500 to grow. When Leak is zero or positive, returning users already offset the outflow.
M1 Retention
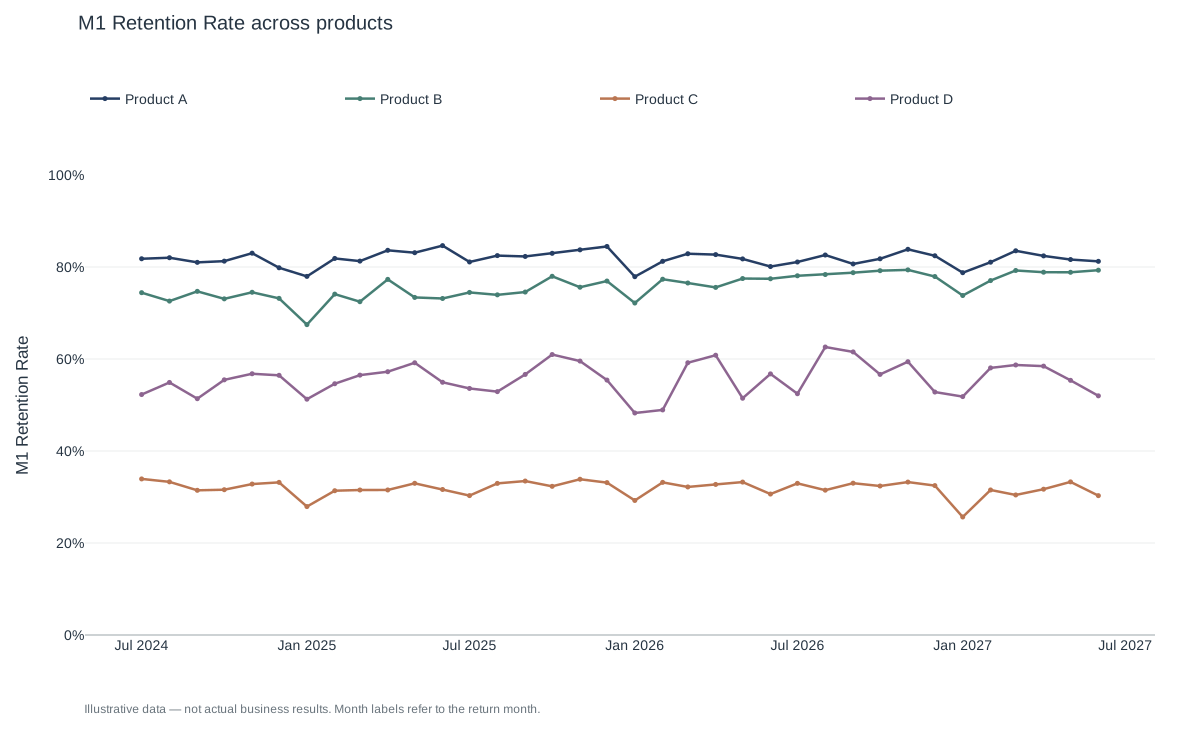
One of the most important transitions is from the New bucket to the Activated bucket. We called the percentage of users who make this transition the M1 Retention Rate.
Outcomes
Building this model gave us a clearer view of the customer lifecycle across our product portfolio, helped guide executive decisions, and contributed to a 20% reduction in our customer acquisition payback period.